Track bias is the most over-claimed idea in Australian racing. It's real. It's also smaller, rarer and far harder to profit from than the confident punter telling you the fence is "dead" after two races. We tested nearly 35,000 recent Australian races, and the market already prices the obvious edges almost to the decimal. The bias that matters is the rare day a track genuinely plays crooked, and you'll need numbers, not vibes, to spot it.
General information only, not advice. There are no guaranteed winners and every bet is a risk. 18+ only.
Key takeaways
Two kinds of bias: structural (the shape of the track) and daily (the rail, weather and ground on the day).
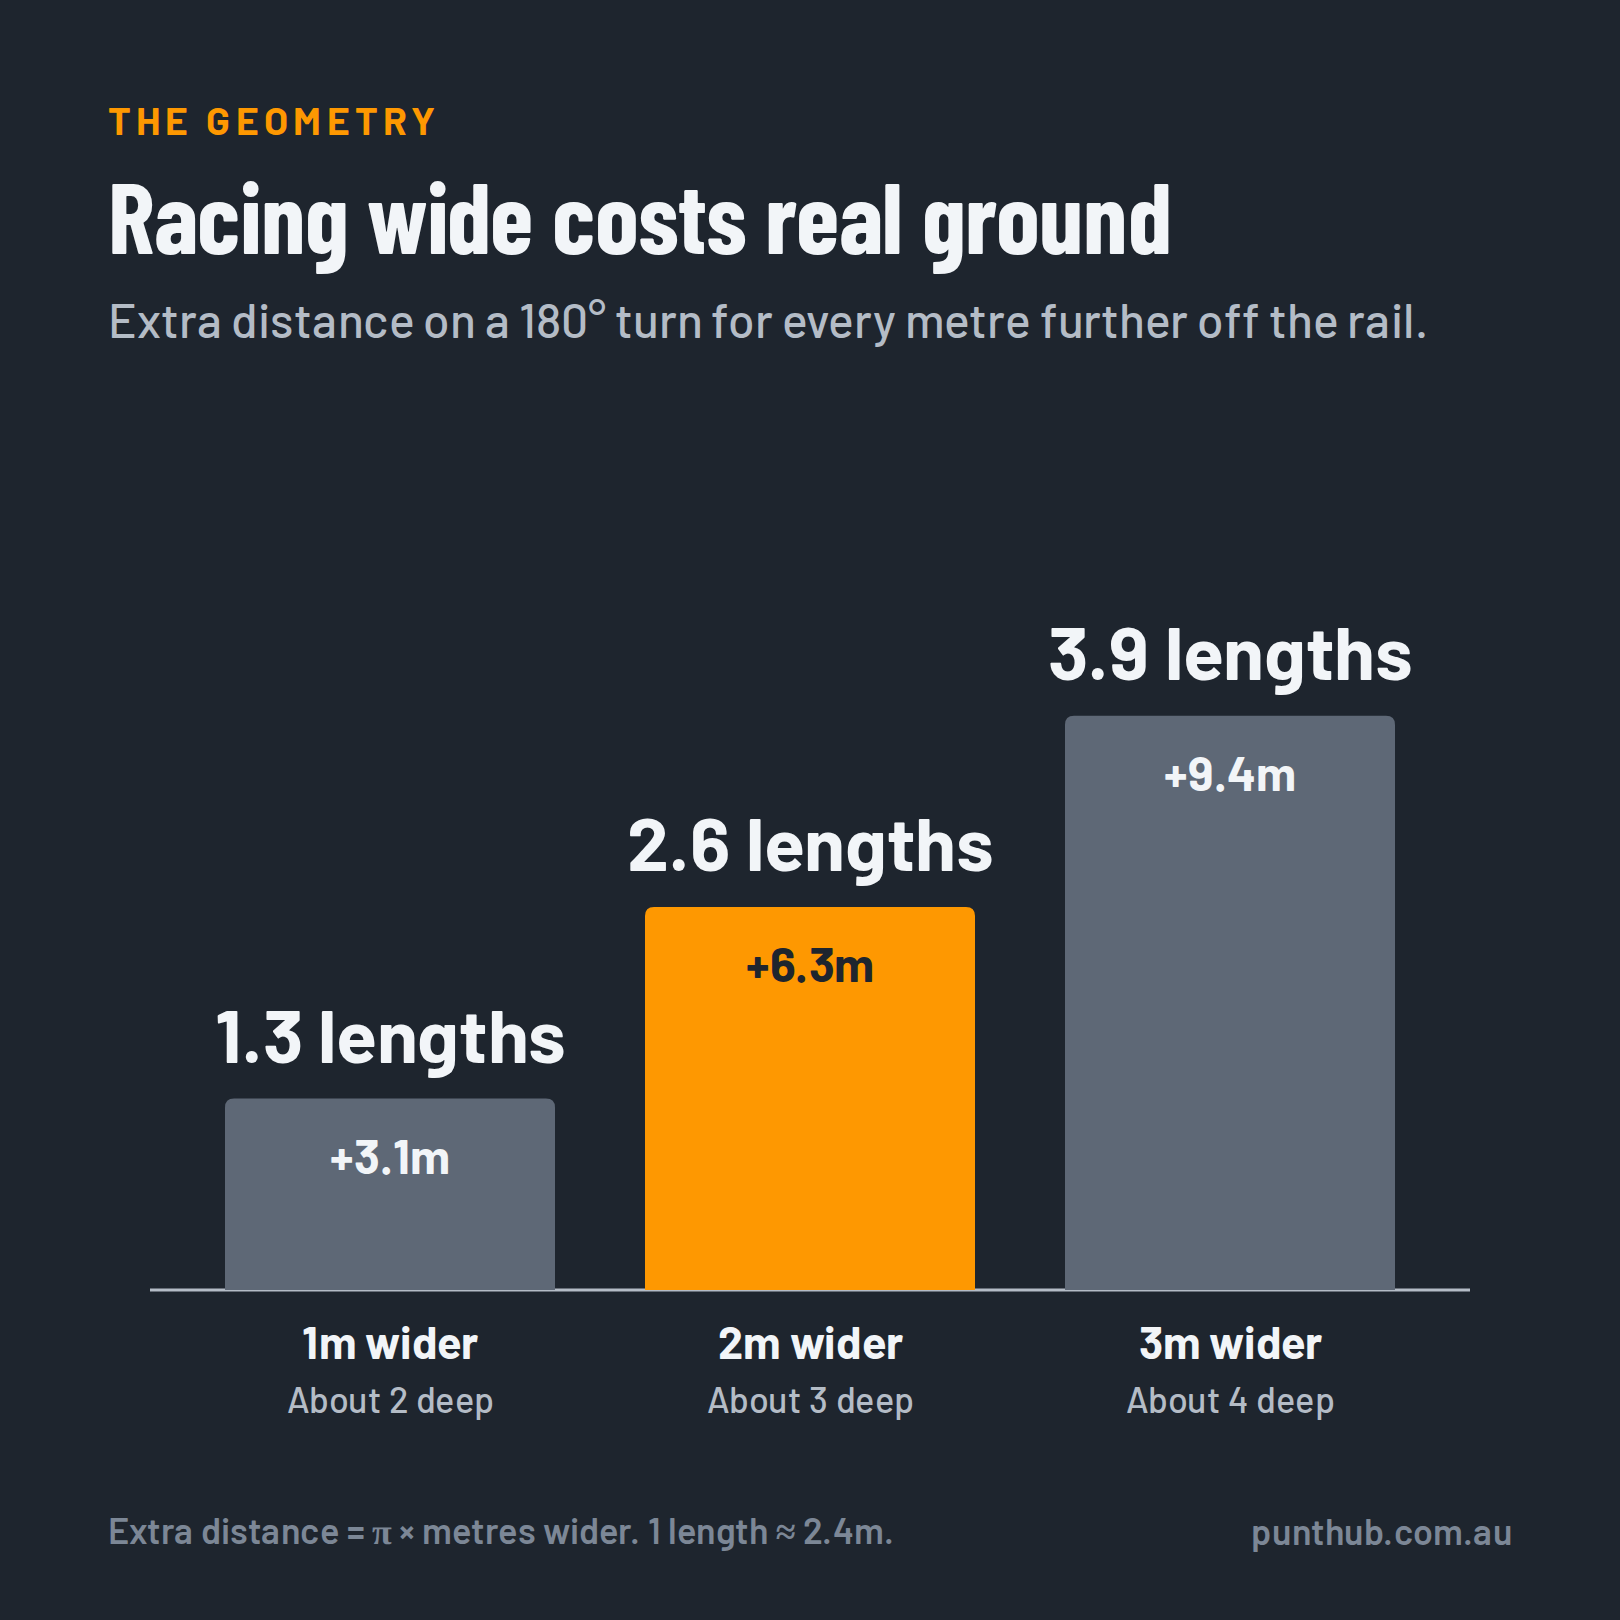
Racing wide costs real ground: about 1.3 lengths per 180° turn for every metre further off the rail.
Leaders win more. The market knows. Predicted leaders won 14.1% of the time, and the market expected 14.2%.
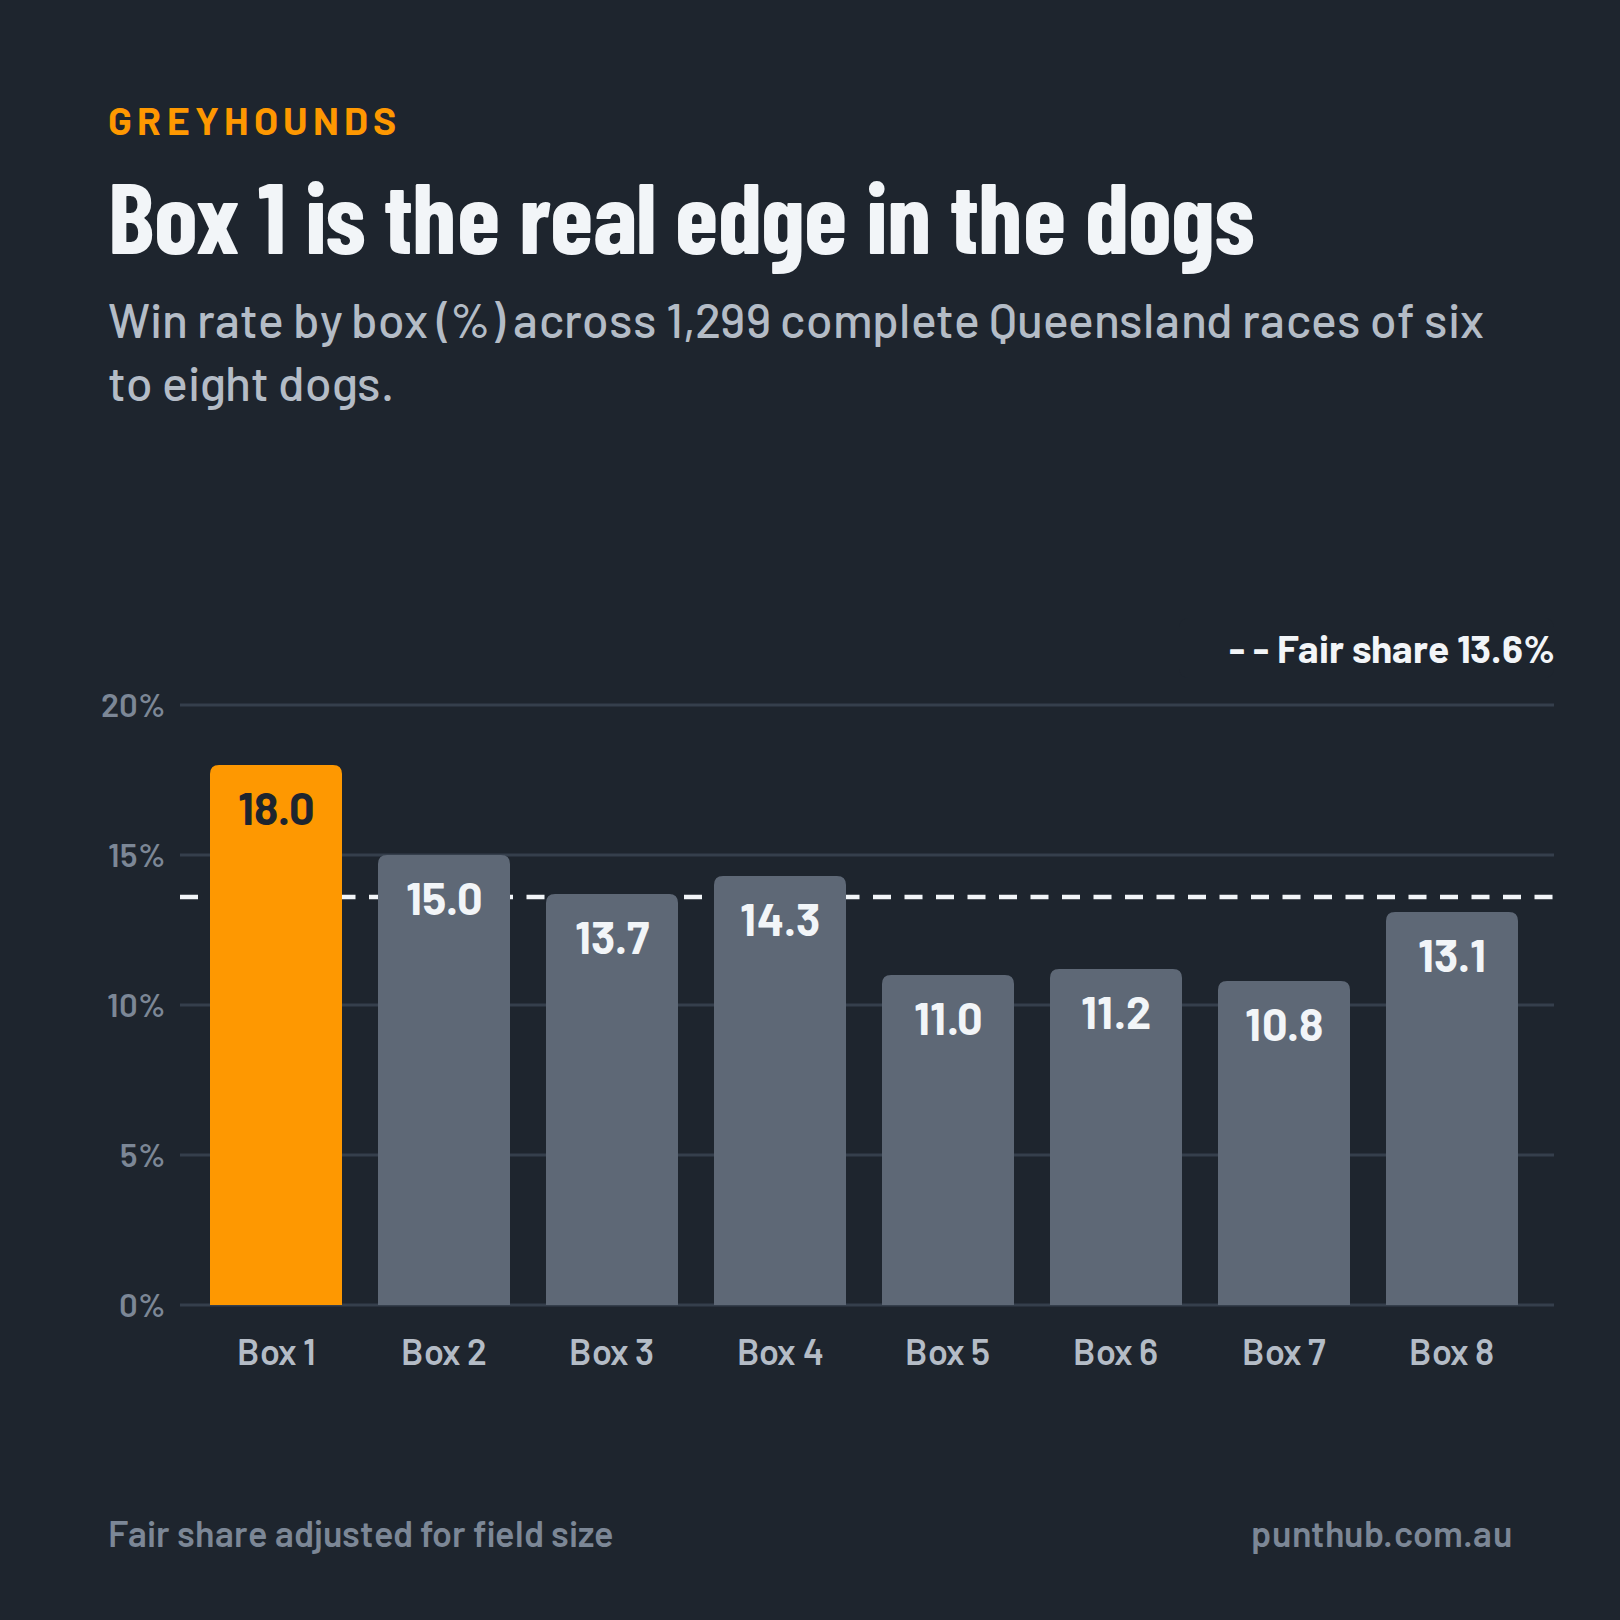
The dogs carry the biggest bias: box 1 won 18.0% of complete Queensland races, against a fair share of 13.6%.
Most "bias days" aren't: a few leaders winning early is usually just the fastest horses winning.
What track bias actually is
Track bias is anything about the track that helps some runners for reasons that have nothing to do with ability.
Structural bias is baked into the course: tight turns, a short run to the first bend, a short straight. It shows up year after year.
Daily bias changes from meeting to meeting. Rain, a chewed-up strip near the fence, wind in the straight, or fresh ground when the rail moves out can all change how a track plays.
Rail position is the big daily driver. The rail usually moves a few metres at a time, and over a season many tracks work out from the True position towards their widest placement and back again. Each move puts the inside runners on ground that hasn't been raced on. Small move, big consequences.
The geometry: why racing wide hurts
On a bend, a horse further off the rail is running a bigger circle. For a 180° turn, the extra distance is π × how much wider it is.
One metre wider adds about 3.1m, or roughly 1.3 lengths (a length is about 2.4m).
Two metres wider, roughly three deep, adds about 6.3m, or 2.6 lengths, on a single 180° turn.
That's why a horse that sat three wide with no cover and still ran fourth may have run the best race on the card. Form guides rarely say so. Your eyes can.
What the research says
The old Australian analysis, 1986
Punters were crunching this long before spreadsheets were cool. A 1986 analysis made two points about Flemington that still hold. Barriers matter little in the Melbourne Cup, with a run of roughly 900m to the winning post and about 1,000m to the first turn. And in straight-six sprints, wide gates aren't automatically bad, because the ground near the grandstand rail can be lengths faster.
Plenty of studies since have counted where winners were at the 400m, and they always find most of them handy. Sounds like a gold mine. It isn't. Winners are often in front at the 400m because they're winning, and you can't bet on that before the jump. That hindsight problem is why we tested pre-race predictions instead.
The classic market test, 1987
A study in Management Science by Canfield, Fauman and Ziemba covered 3,345 races in Vancouver. It found a real advantage for inside posts on a tight track, but the betting prices adjusted to cancel out the profit completely. Knowing about the bias didn't pay, because everyone else knew too.
The big Australian study, 2011 to 2016
A 2025 Journal of Sports Economics study by Falvey, Rajaguru and Wrathall was mainly about jockeys on winning streaks, but it controlled for the draw across 98,577 Australian races. After allowing for the horse, jockey and race, a draw in the seven inside gates lifted the odds of winning by about 12%. The market's own prices already credited it with about 13%. The punters got there first.
We ran the numbers
Speed maps against the market
To get around the hindsight problem, we used pre-race speed-map predictions instead of where horses actually raced. The data covers 325,726 runners in 34,975 Australian races from July 2024 to September 2026, using publicly released speed-map predictions and final market prices. "A/E" is actual winners divided by the winners the market expected, so 1.00 means the market priced it exactly.
Leader (6.8% of runners): won 14.1%, market expected 14.2%, A/E 0.99
On pace (16.4%): won 12.1%, expected 12.3%, A/E 0.98
Off pace (15.2%): won 11.6%, expected 11.2%, A/E 1.04
Midfield (24.2%): won 10.3%, expected 10.3%, A/E 1.00
Off midfield (14.7%): won 9.7%, expected 9.8%, A/E 0.99
Backmarker (22.7%): won 9.3%, expected 9.3%, A/E 1.00
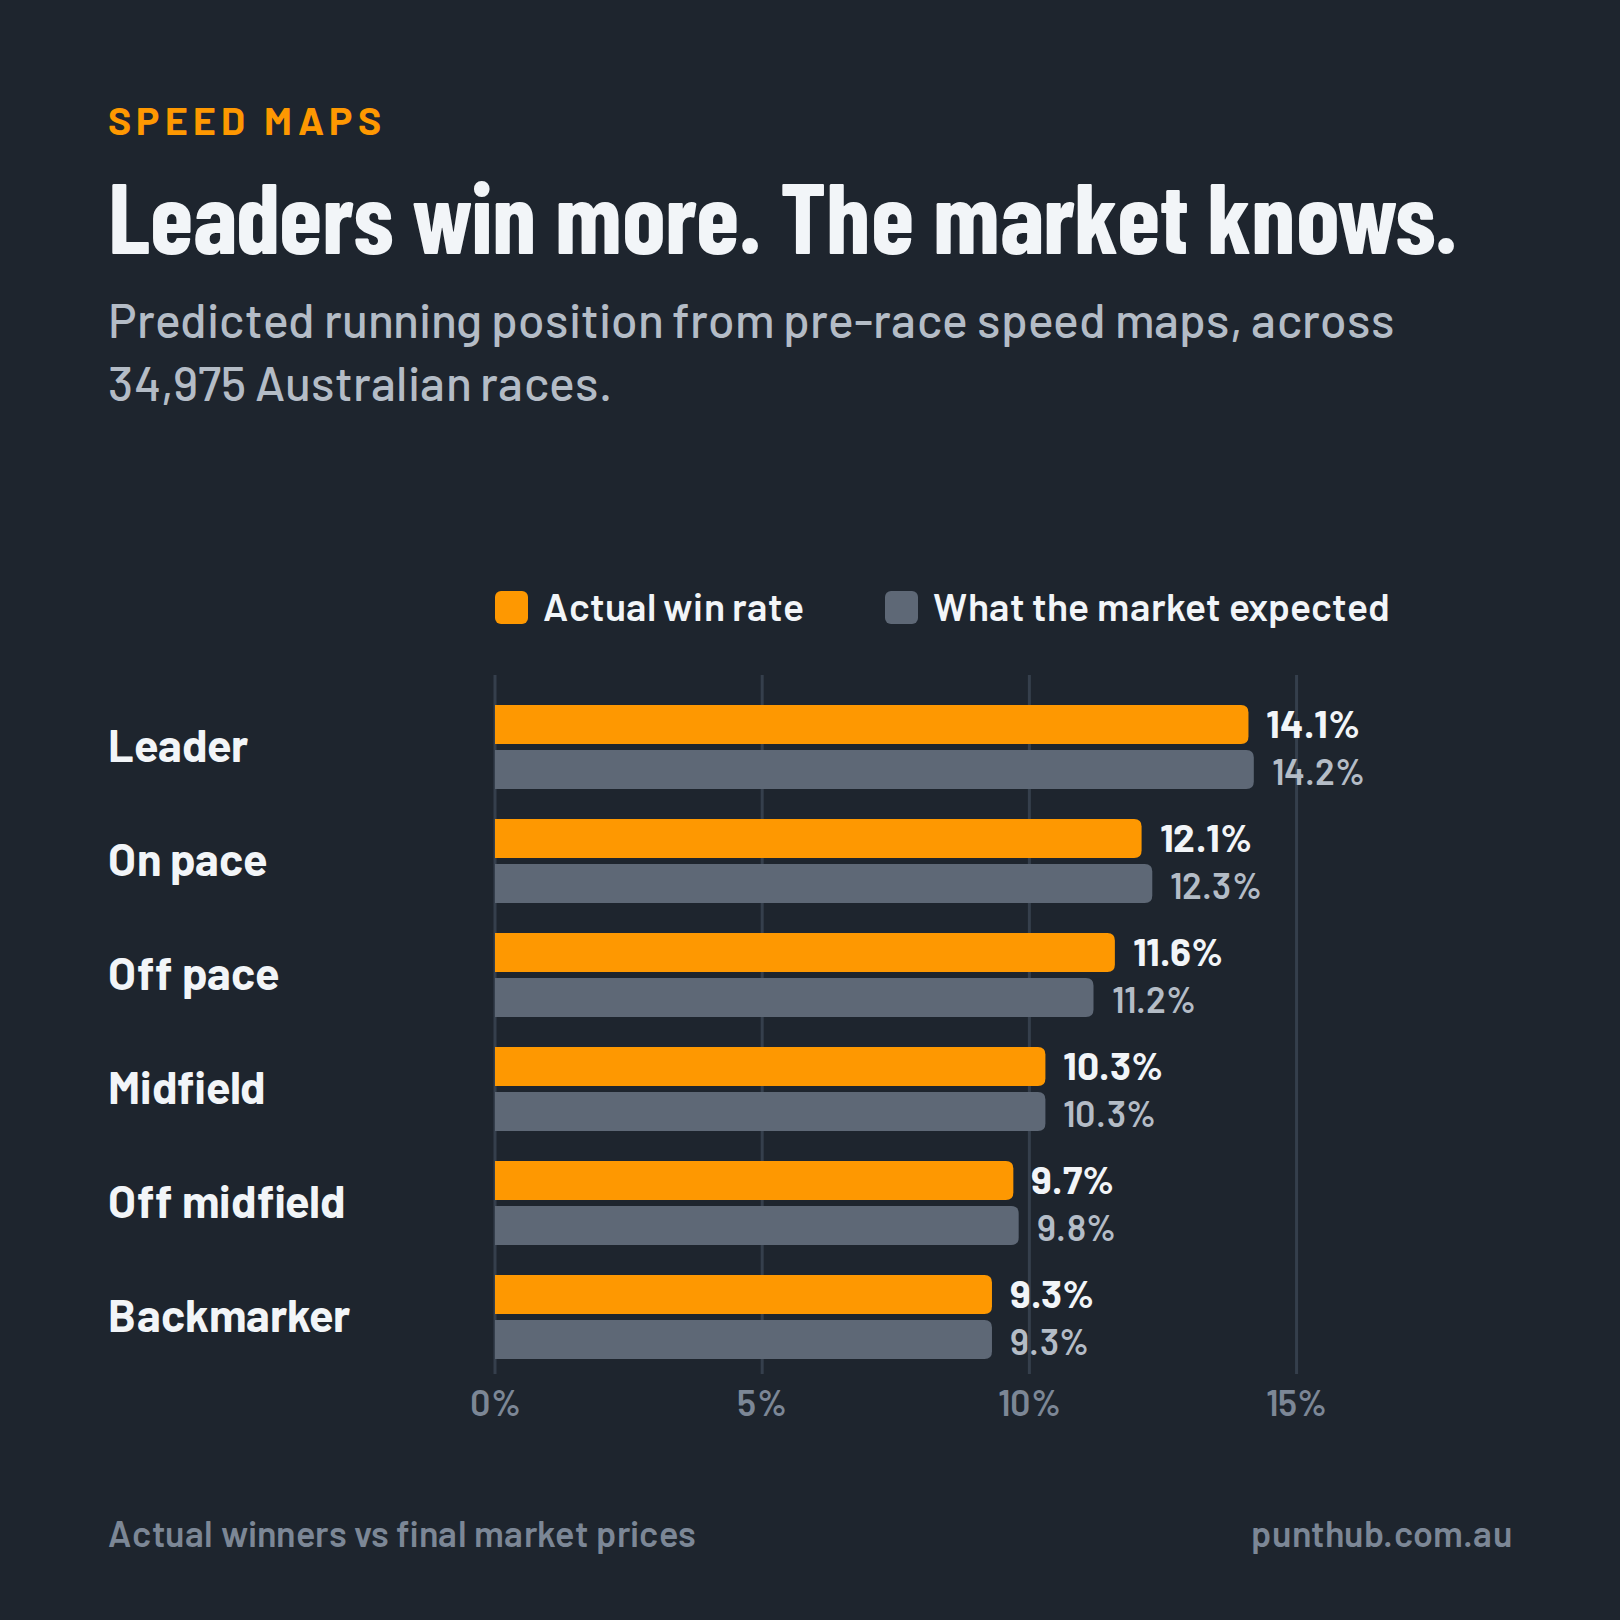
Predicted leaders win about 1.5 times as often as predicted backmarkers. That's the bias, and it's real. But every group sits within a few points of 1.00. The market already knows, so "back the leaders" is not an edge. It's a slogan.
Track by track, the numbers look more dramatic but mostly aren't. Predicted leaders at Eagle Farm scored an A/E of 1.20, and at Morphettville 0.80. But each is based on only a few hundred runners, with a margin of error of about ±0.2, and we tested 16 tracks. Test that many and one or two will look extreme by luck alone. Don't build a system on them.
Greyhounds: the biggest bias in racing
Using Racing Queensland's GPS data, compiled by Australian Racing Open Data, we took 1,299 complete races of six to eight dogs from October 2025 to October 2026:
Box 1: 18.0%
Box 2: 15.0%
Box 3: 13.7%
Box 4: 14.3%
Box 5: 11.0%
Box 6: 11.2%
Box 7: 10.8%
Box 8: 13.1%
Against a fair share of 13.6%, box 1 is about 4.6 standard errors clear. That isn't luck. The GPS shows why: at the 50m mark, box 1 dogs averaged 1.4m off the rail, against 4.5m for box 8. Early speed is everything, too. The dog leading at 50m went on to win 43.5% of races. Boxes 5 to 7 fared worst, squeezed in the middle with no rail and no clear run.
We measured win rates against a fair share, not against the price, so whether the odds have caught up is a separate question. Our guide to racing codes covers how boxes, grades and rugs work.
Harness: the cost of the death seat
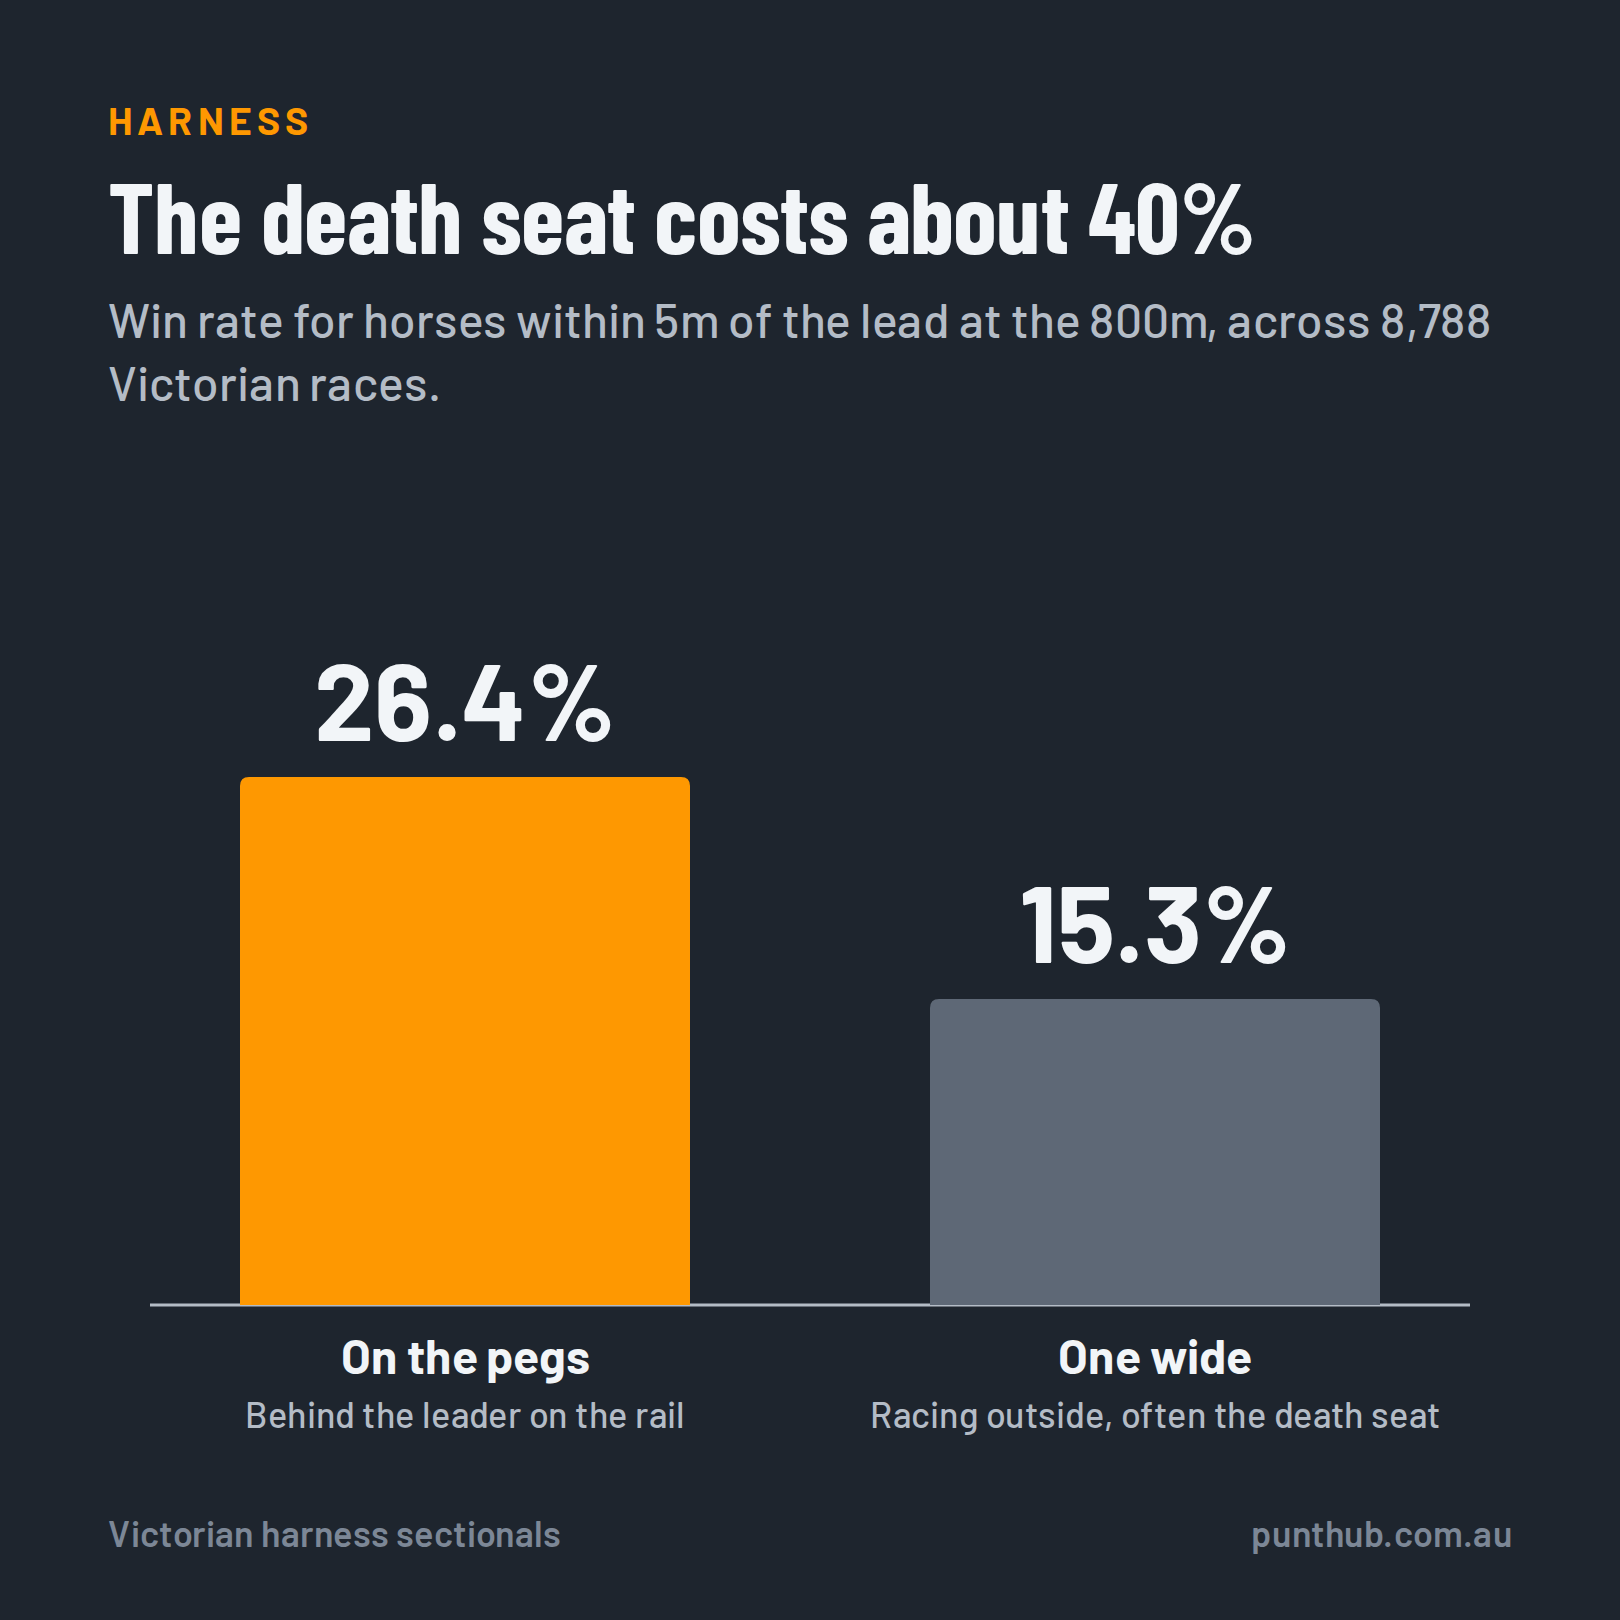
From the same open data, Harness Racing Victoria's sectionals cover 8,788 Victorian races since January 2024. Among horses within 5m of the lead at the 800m, those on the pegs won 26.4% of the time, against 15.3% for those racing one wide. Doing the work outside cuts your strike rate by about 40%. The death seat earns its name.
Bias calls on X: real versus imagined
Some of the sharpest track-bias analysis in Australia happens on X, where a handful of analysts post the race-by-race data, not just the hunch. It also happens to be where the worst calls get made.
The bias that wasn't: after Caulfield on 18 November 2023, plenty of punters swore there was a strong fence bias. A race-by-race review found four of nine winners were never on the fence, and three winners raced three wide or more. The verdict was a "marginal pattern", with the day's biggest over-performers against their starting prices racing off the pace and wide.
The bias that was: across two Rosehill meetings in mid-2026 with the rail out 6m to 7m, the same analyst counted 17 winners on the fence at the 800m, when market prices said to expect 9.5. Our check: the chance of 17 or more from 20 races by luck is about 1 in 1,600. That's a genuine bias.
The warning: every time a couple of leaders win early on a card, the "track bias" calls start. Usually the fastest horses just won.
Myth-busting: Melbourne Cup barriers
Barrier 5 is commonly cited as the Cup's most successful gate, with nine winners, while barrier 18 was long believed never to have produced a winner until Verry Elleegant in 2021 (the Victoria Racing Club's records show Gatum Gatum started from 18 in 1963). Sounds like a pattern. So we simulated 20,000 sets of 102 Cups, with fields of 20 to 24 and every barrier given an equal chance:
The "best" barrier typically finished with nine wins, the same as barrier 5's real total.
Two or three barriers usually ended up with one win or fewer.
About one time in five, at least one barrier from 1 to 18 went 97 runnings without a winner.
The Cup's barrier history looks exactly like pure chance. Barrier stats from a single race are trivia, not bias, and anyone selling them as a system is telling a story.
Spotting a bias on the day
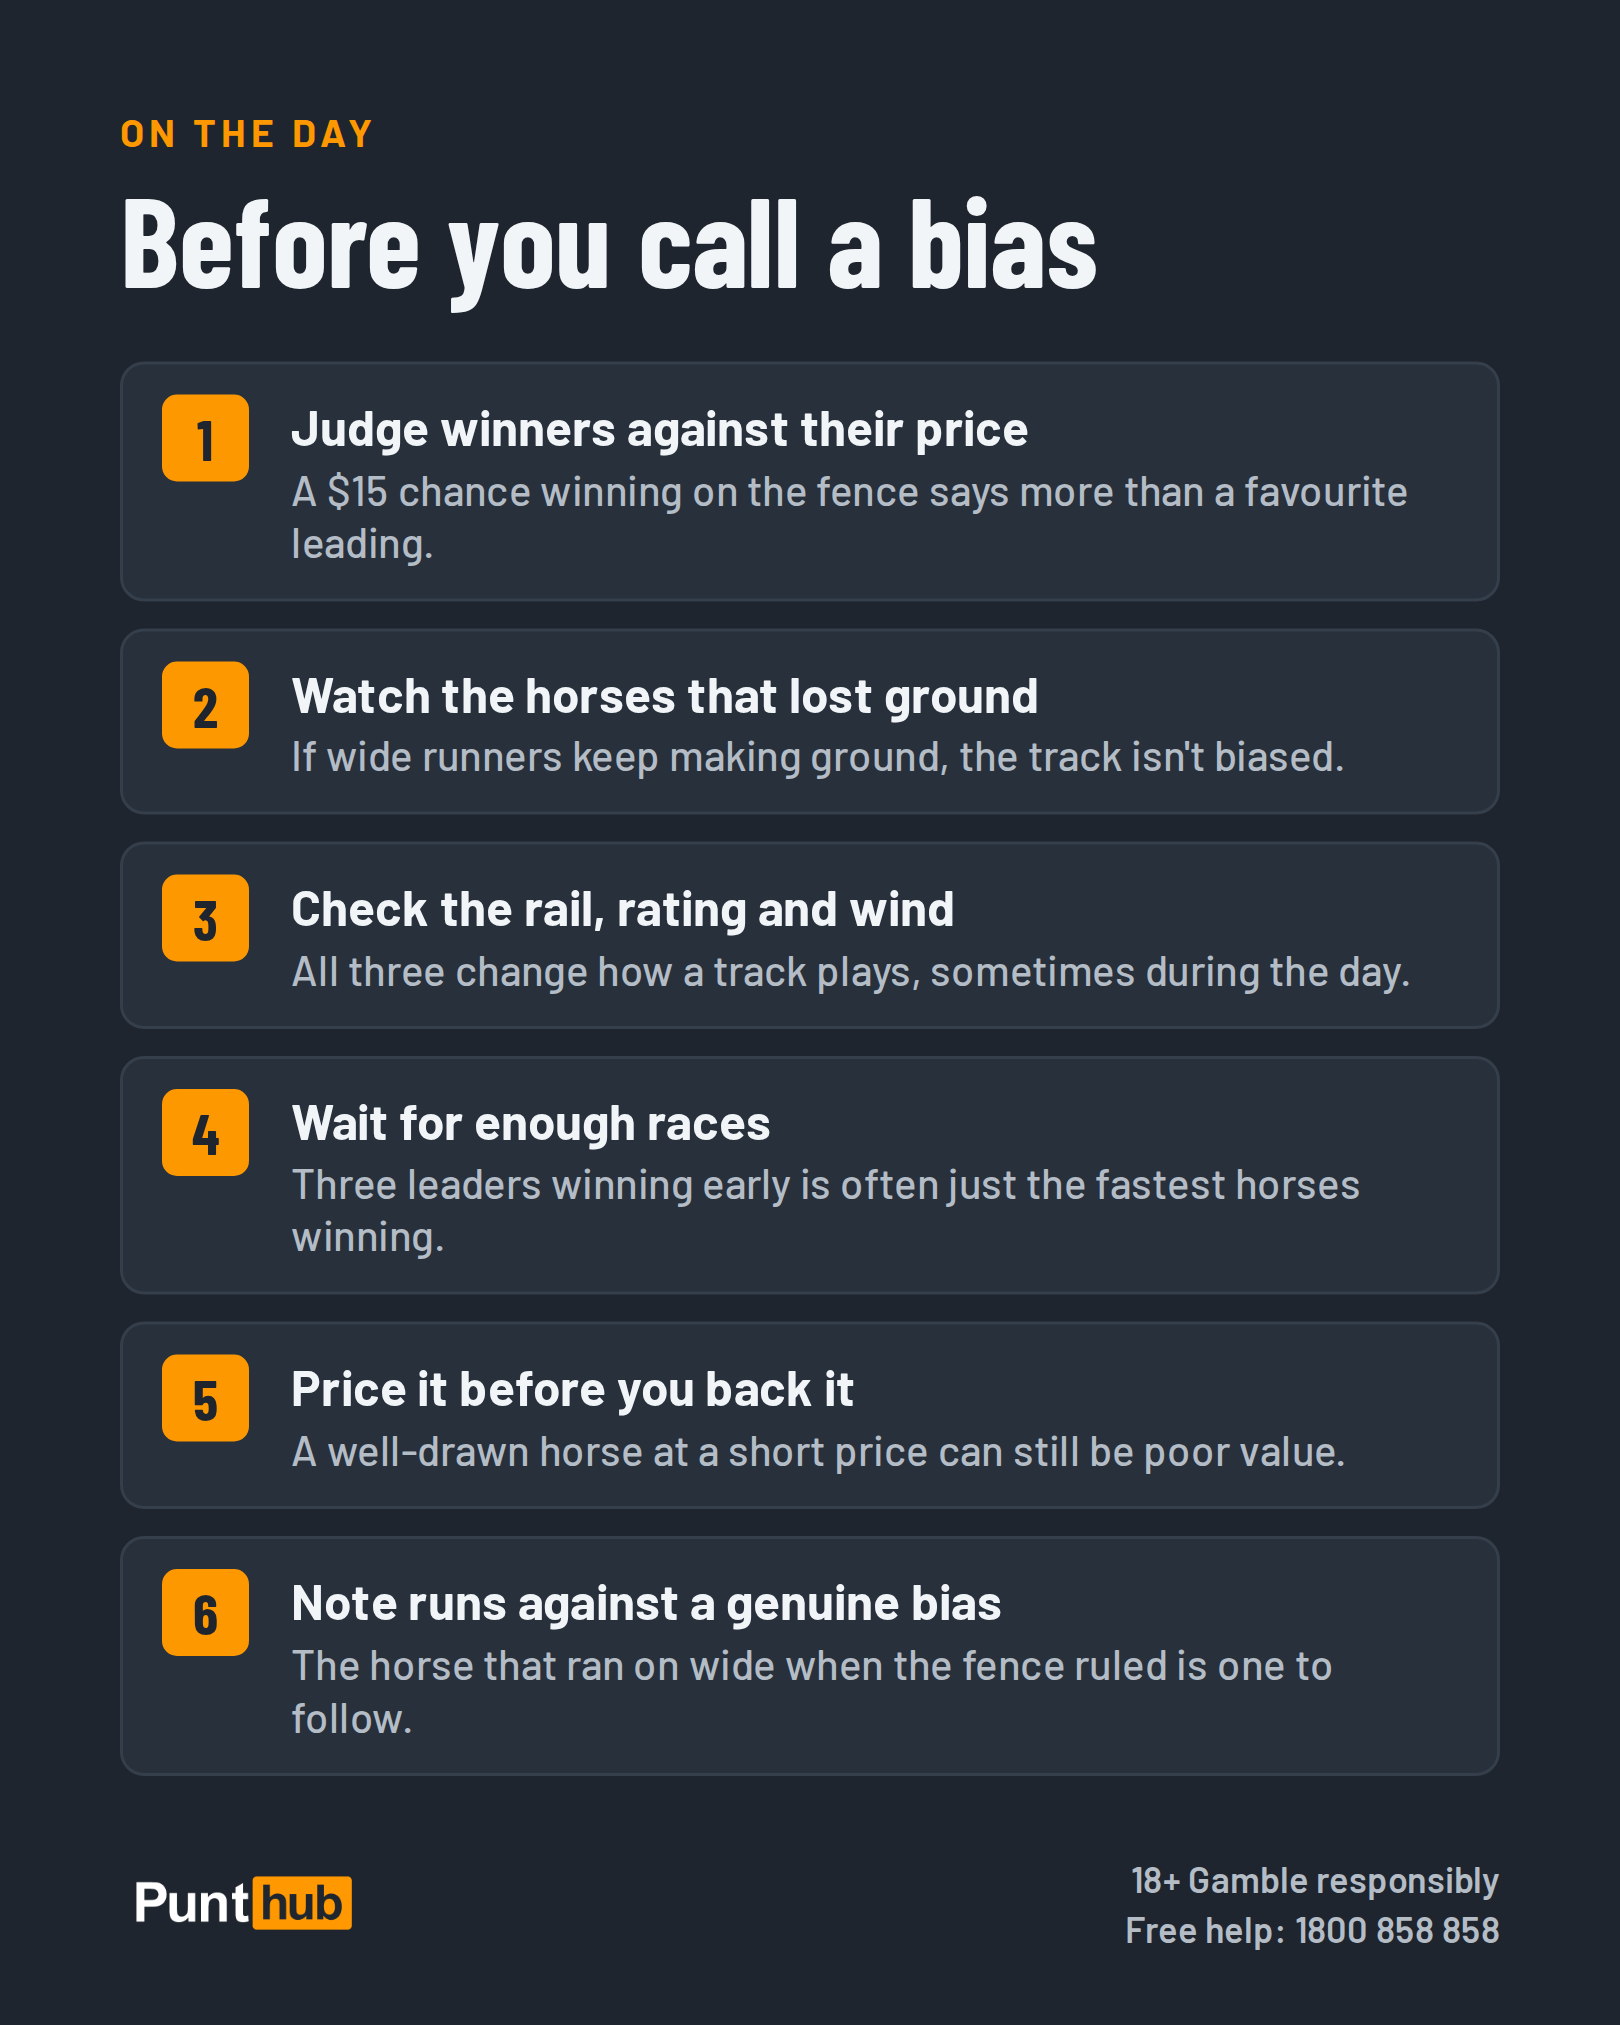
Judge winners against their price: a well-backed leader winning proves nothing. A $15 chance winning on the fence is far more telling.
Watch the horses that lost ground: if runners coming wide keep making ground on the winners, the track isn't biased.
Check the rail, the rating and the wind: all three can change how a track plays, and they can change during the day.
Don't call it after three races: if leaders normally win one race in five, three or more of eight will be won by leaders about 20% of the time, purely by chance.
How to use bias without kidding yourself
Know the structural stuff: tight tracks, short runs to the first turn and the dogs are where draws matter most.
Price it: a well-drawn horse at a short price can still be poor value. Check the live odds and market movers before you get excited.
Mark runs against a genuine bias: the horse that ran on wide at Rosehill when the fence ruled is the one to note for next start.
Keep records: test your bias calls over hundreds of races, not one carnival.
New to race shape and value? Start with our guide to horse racing betting strategies.
Responsible gambling
No bias makes a bet safe. Set deposit and time limits before you start, and stop when it stops being fun. BetStop lets you self-exclude from every licensed Australian online wagering operator. Free, confidential help is available on 1800 858 858 or at gamblinghelponline.org.au, and our responsible gambling resources have more.
Frequently asked questions
What is track bias?
Anything about the track that favours some runners for reasons unrelated to ability, like the inside on a tight track, or the fence when the rail has moved onto fresh ground.
Do leaders win more often?
Yes. In 34,975 recent Australian races, predicted leaders won 14.1% of the time, against 9.3% for predicted backmarkers. But the market expected almost exactly that, so it's not an edge on its own.
Do inside barriers help?
On average, yes. In 98,577 Australian races, an inside-seven draw lifted the odds of winning by about 12%, and the market already priced it in.
Is box 1 an advantage in greyhounds?
Yes. In Queensland's GPS-tracked races, box 1 won 18.0% against a fair share of 13.6%. That's a real bias, not luck.
Are some Melbourne Cup barriers lucky?
No. A simulation with every barrier given equal chances produces the same spread of wins and droughts as the real history.
How do I know if a track is biased on the day?
Compare winners with their prices, watch whether wide runners are still making ground, and wait for more than a few races before you call it.
More answers in the Punt Hub FAQ.
Disclaimer: General information only, not advice. Our analysis uses publicly released data and simplifying assumptions. Greyhound and harness data: Australian Racing Open Data (PandaVision), ODC-BY 1.0. Past patterns don't guarantee future results. Free, confidential support: 1800 858 858.
18+ only. Gamble responsibly.